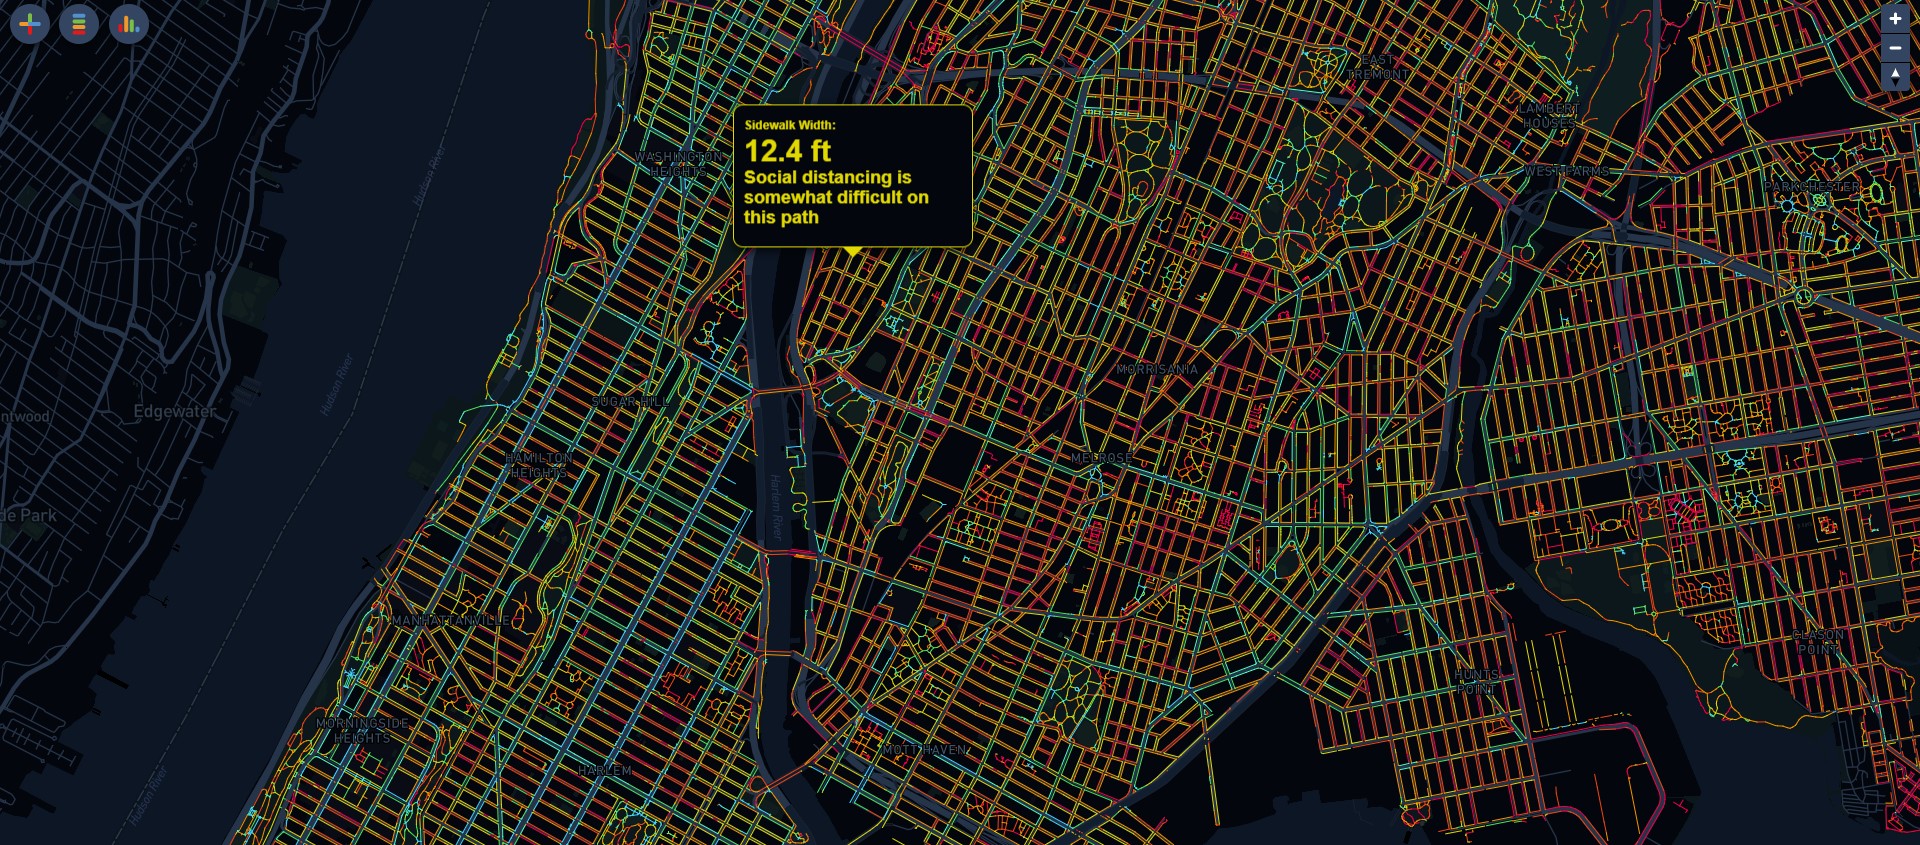

This map is intended to give an impression of how sidewalk widths impact the ability of pedestrians to practice social distancing.
How I Started
Generally, what I’m building has to not exist, or exist but not be accessible to people. I'm always interested to see more data around the pedestrian sphere, thinking about importance of equality of streets and public environments. I thought it would be useful to look at social distancing during the Covid-19 pandemic, and create a map that data novices could use to understand this information.
Used Data
How I Built This
Sidewalk Widths NYC was built starting from the Sidewalk planimetrics Open Data dataset by calculating the center of each sidewalk segment and, ultimately, each segment’s width. It uses Mapbox to display each sidewalk segment, color coded by the relative difficulty of social distancing based on its width. For more information about this project’s creation, you can explore the documentation and code on GitHub.