How To
Getting Started With Open Data
NYC Open Data allows New Yorkers to engage with the information that is produced and used by the City government.
The following tutorials will show you how to filter, map, and export 311 Service Requests during a particular time period. 311 is New York City’s non-emergency call center that allows residents to make service requests, file complaints, and get additional information about the City.
Tutorial: Applying a Filter and Exporting 311 Data
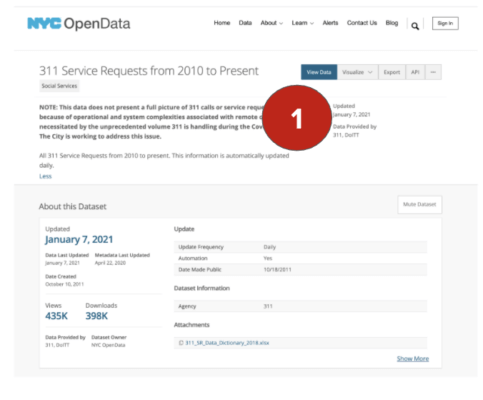
1. Open the 311 Service Requests 2010 to Present dataset in your web browser. This will take you to the dataset’s primer page. This page contains important information about the data, such as the date it was last updated and its data dictionary (a repository of information detailing the format and structure of the data itself). It also displays a preview of the actual dataset. At the top of the screen, click “View Data.” This takes you into the dataset, which contains over 24 million rows of service requests.
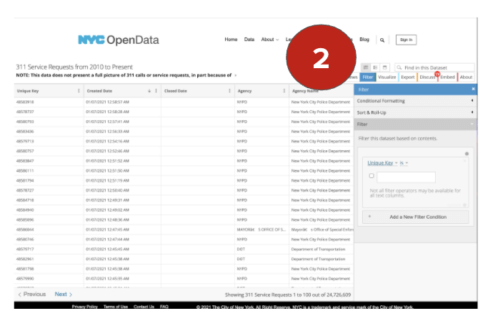
2. To filter a portion of the data, click on the blue “Filter” tab in the upper right corner. The filter function allows you to narrow the search results into more manageable bits.
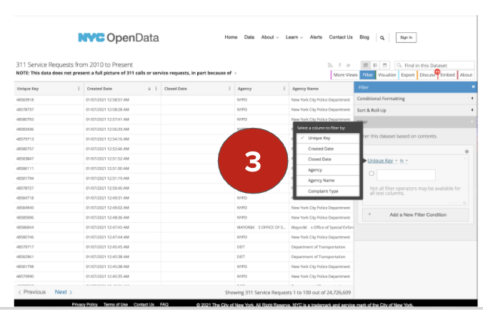
3. Once you are in the filter tab, click on the words “Unique Key.” In the drop-down, select “Created Date” and “is between.” Write in two dates of your preference and press enter.
4. The data will now be filtered to display only service requests for that particular period. To export this filtered view in the format of your choice, click the “Export” button in the upper right corner.
Tutorial: Creating a Simple Map using 311 Data
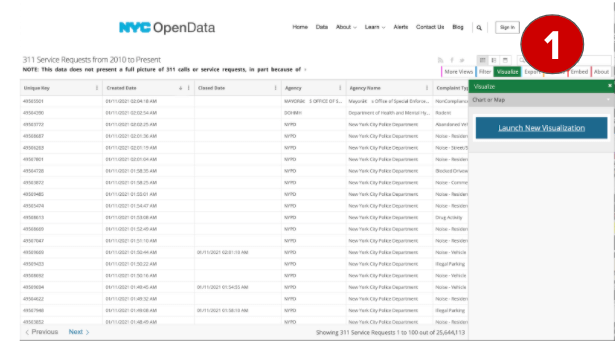
1. To map the 311 data from the dataset primer page, click “View Data” and select the green “Visualize” tab at the upper-right hand corner of the screen. Select “Launch New Visualization.” This will take you to a new window.
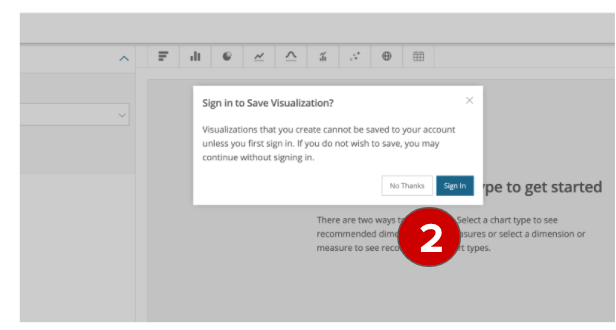
2. At this stage, you will be prompted to sign in. Signing in is optional, but it will allow you to save your visualizations and filters to return to later. If you wish to continue without saving, simply click “No Thanks.”.
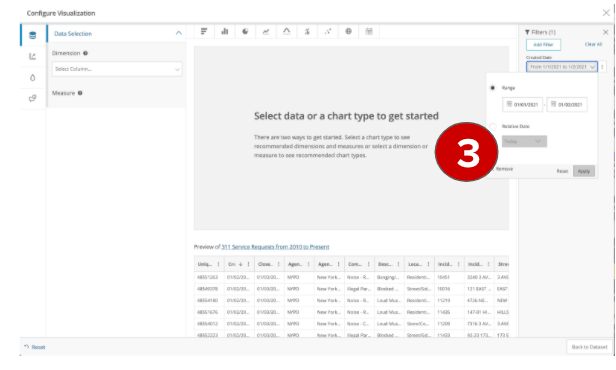
3. In the top right corner of this new page, select “Add Filter.” Filter the data by “Created Date” according to your desired time period.
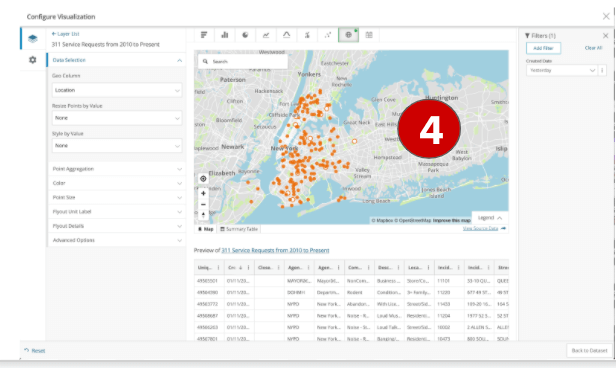
4. Success! You have just created a filtered view of 311 Service Requests of a particular period, and visualized the location of these requests on a map.
Some quick tips for navigating
NYC Open Data
- Data Dictionaries should be your key resource
Data can be complex. Some datasets contain millions of records and many unfamiliar terms. Be sure to review a dataset’s primer page for additional information about a dataset, including its data dictionary. In the data dictionary, you’ll find definitions of terms and values in the dataset.
- Filtering is critical for navigating large datasets
In general, if you experience difficulty manipulating and downloading larger datasets, you should restrict the number of records that appear using the “filter” function. In this panel, users may “Add a New Filter Condition” and select attribute values that are exact matches with the “is” condition, or fall within a range of values with the “contains” condition. A narrower selection of results will require less computing power to view and manipulate data, and will create smaller data files that are quicker to download onto your local device.
- Ask questions
If you run into issues or have questions about anything Open Data, send us a note and we’ll get back to you!
Further Resources
Interested in more in-depth tutorials? Here are some resources to explore that are open and free to explore:
- These how-to videos produced by our vendor, Socrata, provide additional tutorials on how to use various tools on NYC Open Data
- Attend a free Open Data 101 Class
- BetaNYC video tutorials
- BetaNYC curricula and resources for their Fundamentals of NYC Open Data courses
- Datapolitan offers slides and slide source code for their Introduction to Open Data course
Looking to dig deeper? The following resources offer advanced analytics perspectives on NYC Open Data. If you think we’ve missed anything, drop us a line!
- The NYC Open Data Project Gallery is a repository of open data projects built by members of the public — it will show how it is used by local activists to advocate for change, by entrepreneurs to develop products, by teachers to teach analytics skills the classroom, and more!
- BetaNYC is a civic organization dedicated to improving lives in New York through civic design, technology, and data. They manage data.beta.nyc and host events to discuss Open Data.
- NYCityMap is targeted towards non-mapping professionals and provides a wealth of geographic-based information from the input of a single location.
- Resident Mario and IQuantNY are blogs by New York civic technologists featuring quantitative analyses of Open Data.
- NYC GitHub showcases New York City projects and code. GitHub is a version control system used by software developers and a repository for software projects created by developers using open source code.
- Data2go.nyc is a free, easy-to-use online mapping and data tool that brings together federal, state, and City data on a broad range of issues critical to the well-being of all New Yorkers.
API Documentation
- Want to win that hackathon or build the next great Open Data app? Get started with Socrata APIs.
- Socrata APIs provide rich query functionality through the “Socrata Query Language” (SoQL), which borrows heavily from Structured Query Language (SQL). Its paradigms should be familiar to developers who have worked with SQL and easy to learn for those who are new to it.
- The “endpoint” of a SODA API is a unique URL that represents an object or collection of objects. Every dataset, and even every individual data record, has its own endpoint. The endpoint is what you’ll point your HTTP client at to interact with data resources.