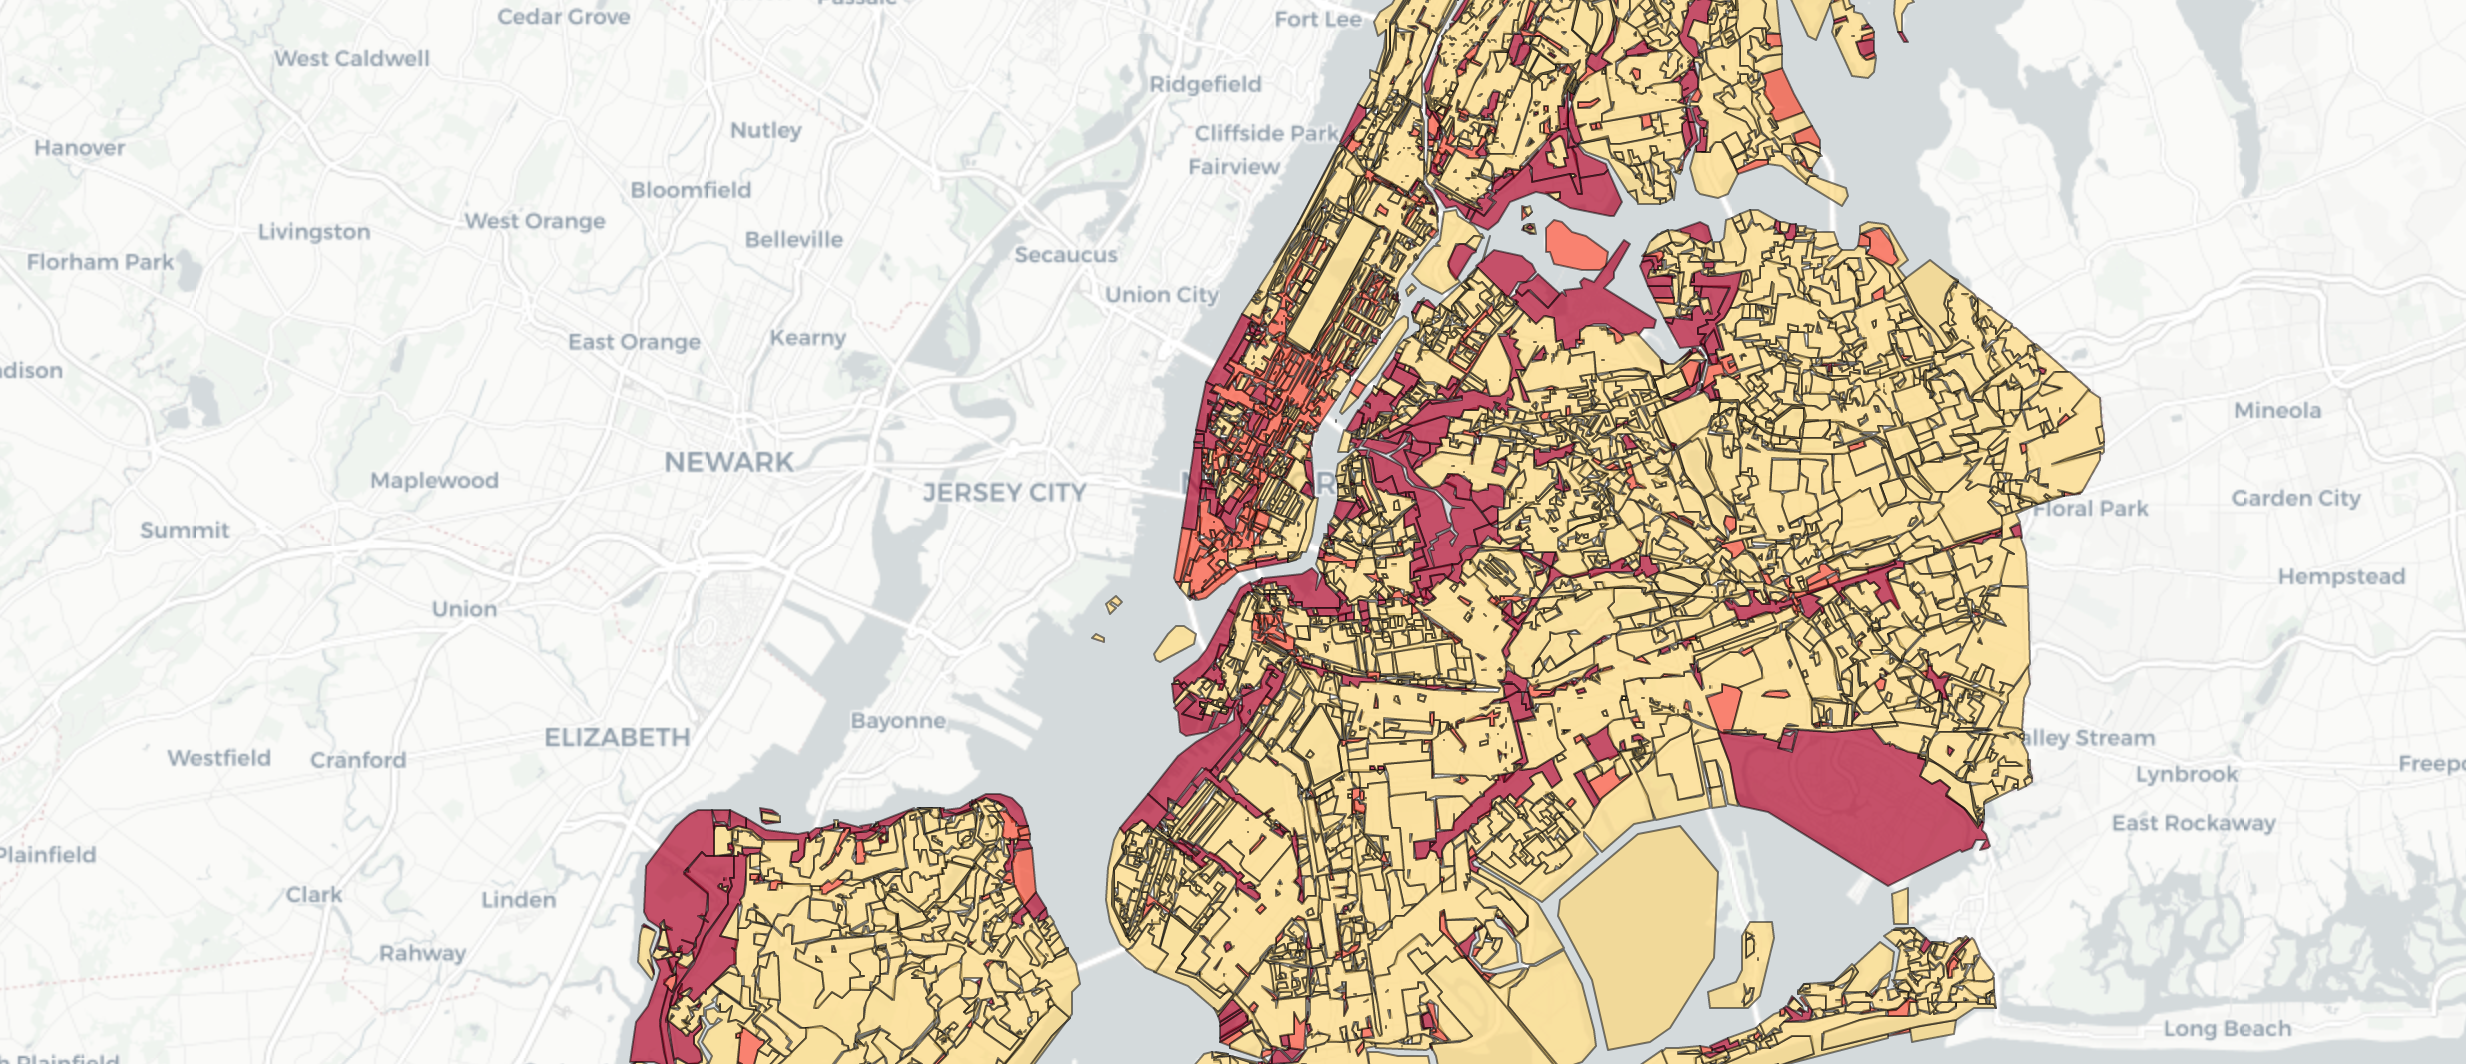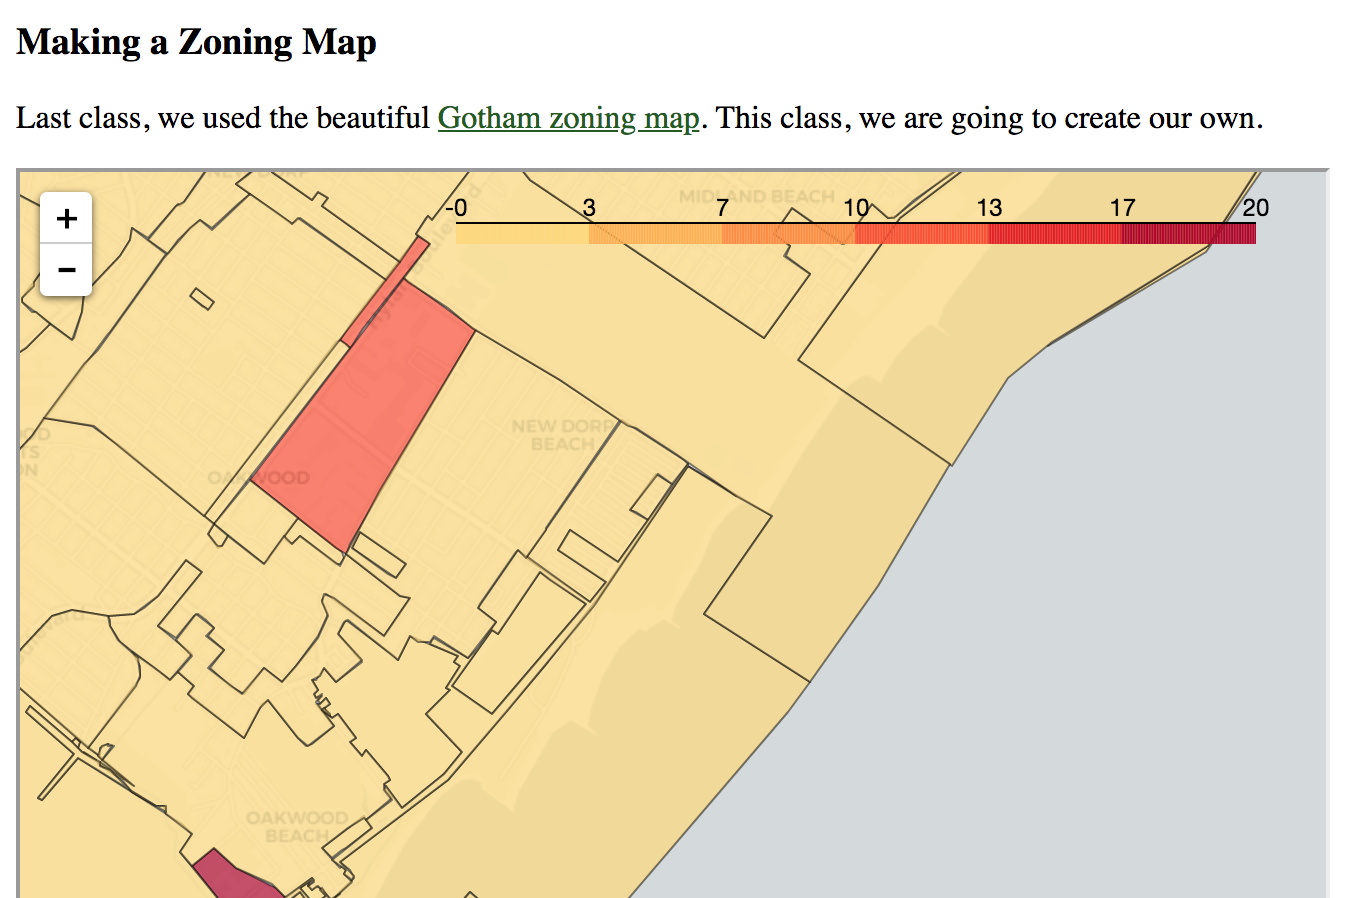
The goal was to introduce to build zoning maps that showed patterns that are difficult to see from the original data (such as grouping together zoning classifications to make a map that shows where buildings of 5 stories or higher, or above a certain density, are allowed).
How I Started
The audience was students in an urban-planning themed honors seminar ("Seminar 4: Shaping the Future of New York City"). The project assumes students have already built choropleth maps and focused on data wrangling.
Used Data
How I Built This
It was built using Python, the fabulous pandas library, and lovely map-making library, folium (that uses leaflet.js). It took the students about 30 minutes of data manipulation to create the map (all had created a choropleth map earlier).


