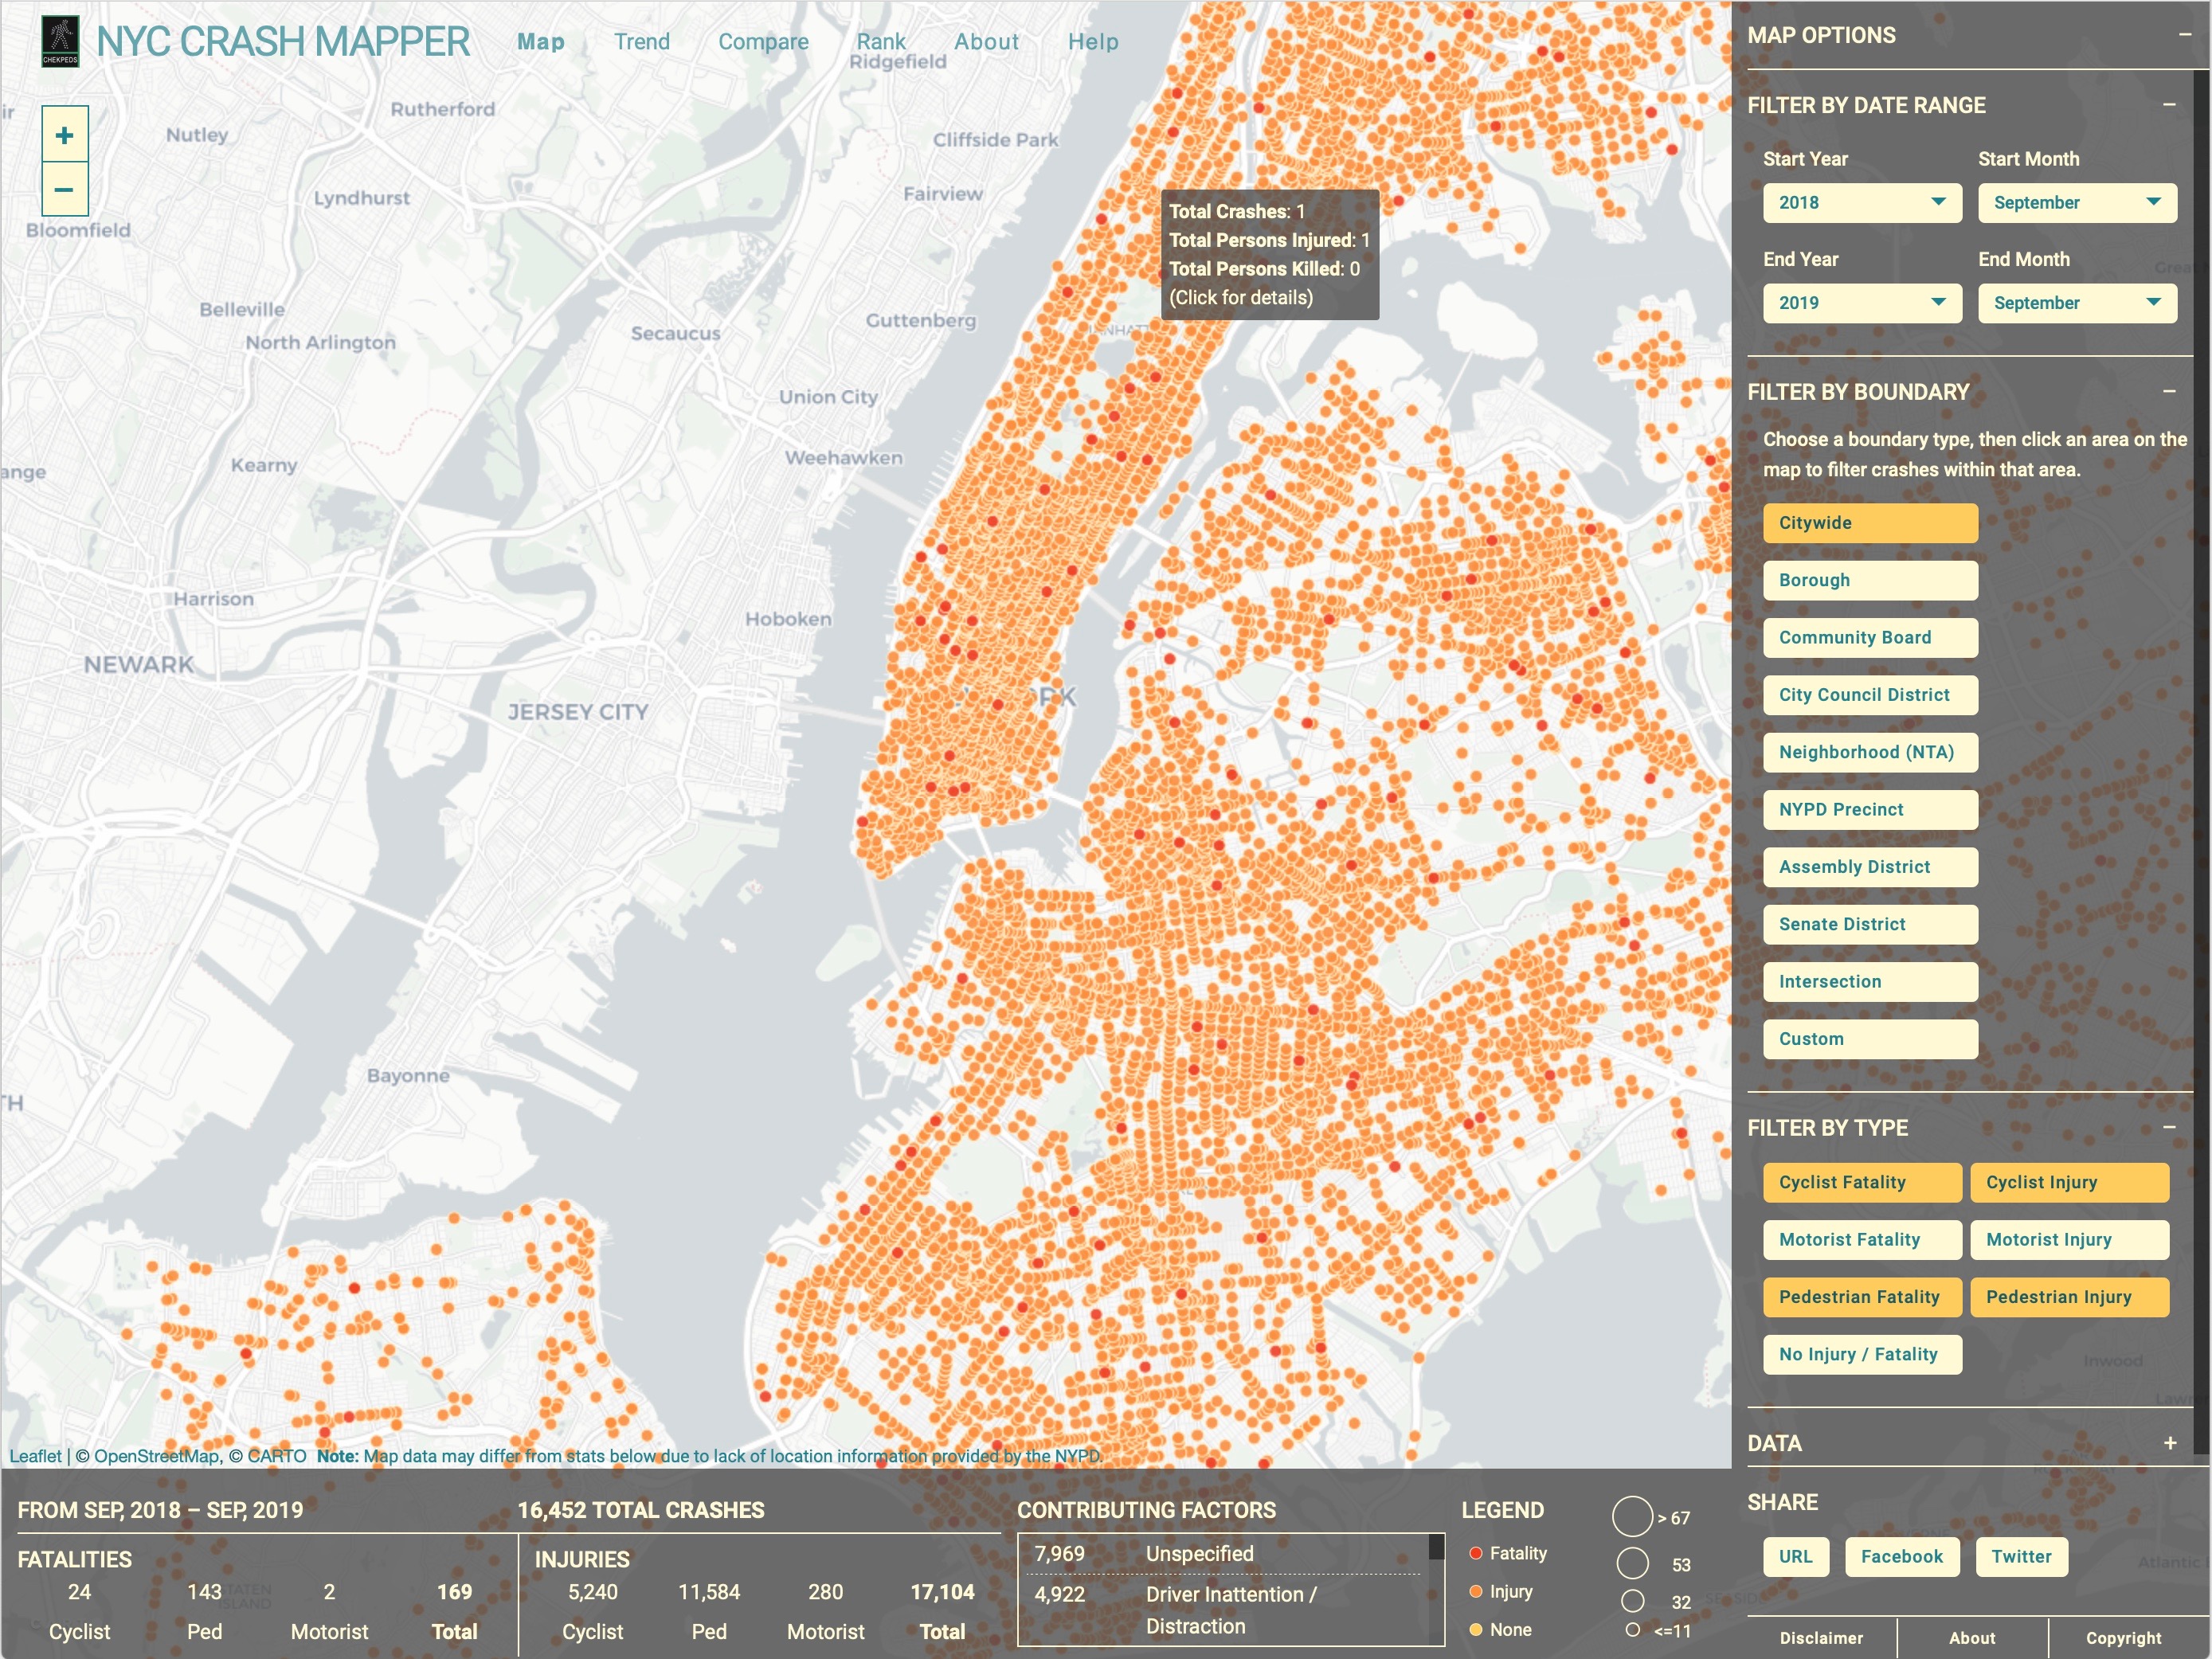
This tool allows advocates, press and elected officials to prioritize the most dangerous intersections to be fixed in order to achieve Vision Zero.
How I Started
Crashmapper allows a user to create a customized filter of any area and track it over time to see the impact of Vision Zero improvements on a corridor. Users can compare two selected areas’ performance against each other and to a citywide or borough-wide reference, while filtering by date range or type of crash.
Used Data
How I Built This
Crashmapper is the result of four iterations of a mapping initiative started by Transportation Alternatives in 2006 and continued by John Kraus. The current version of the application with charts was built in 2017 by GreenInfo Network.
The original version of Crashmapper was built using Carto and React over six months, with another two months of development for this current version.


