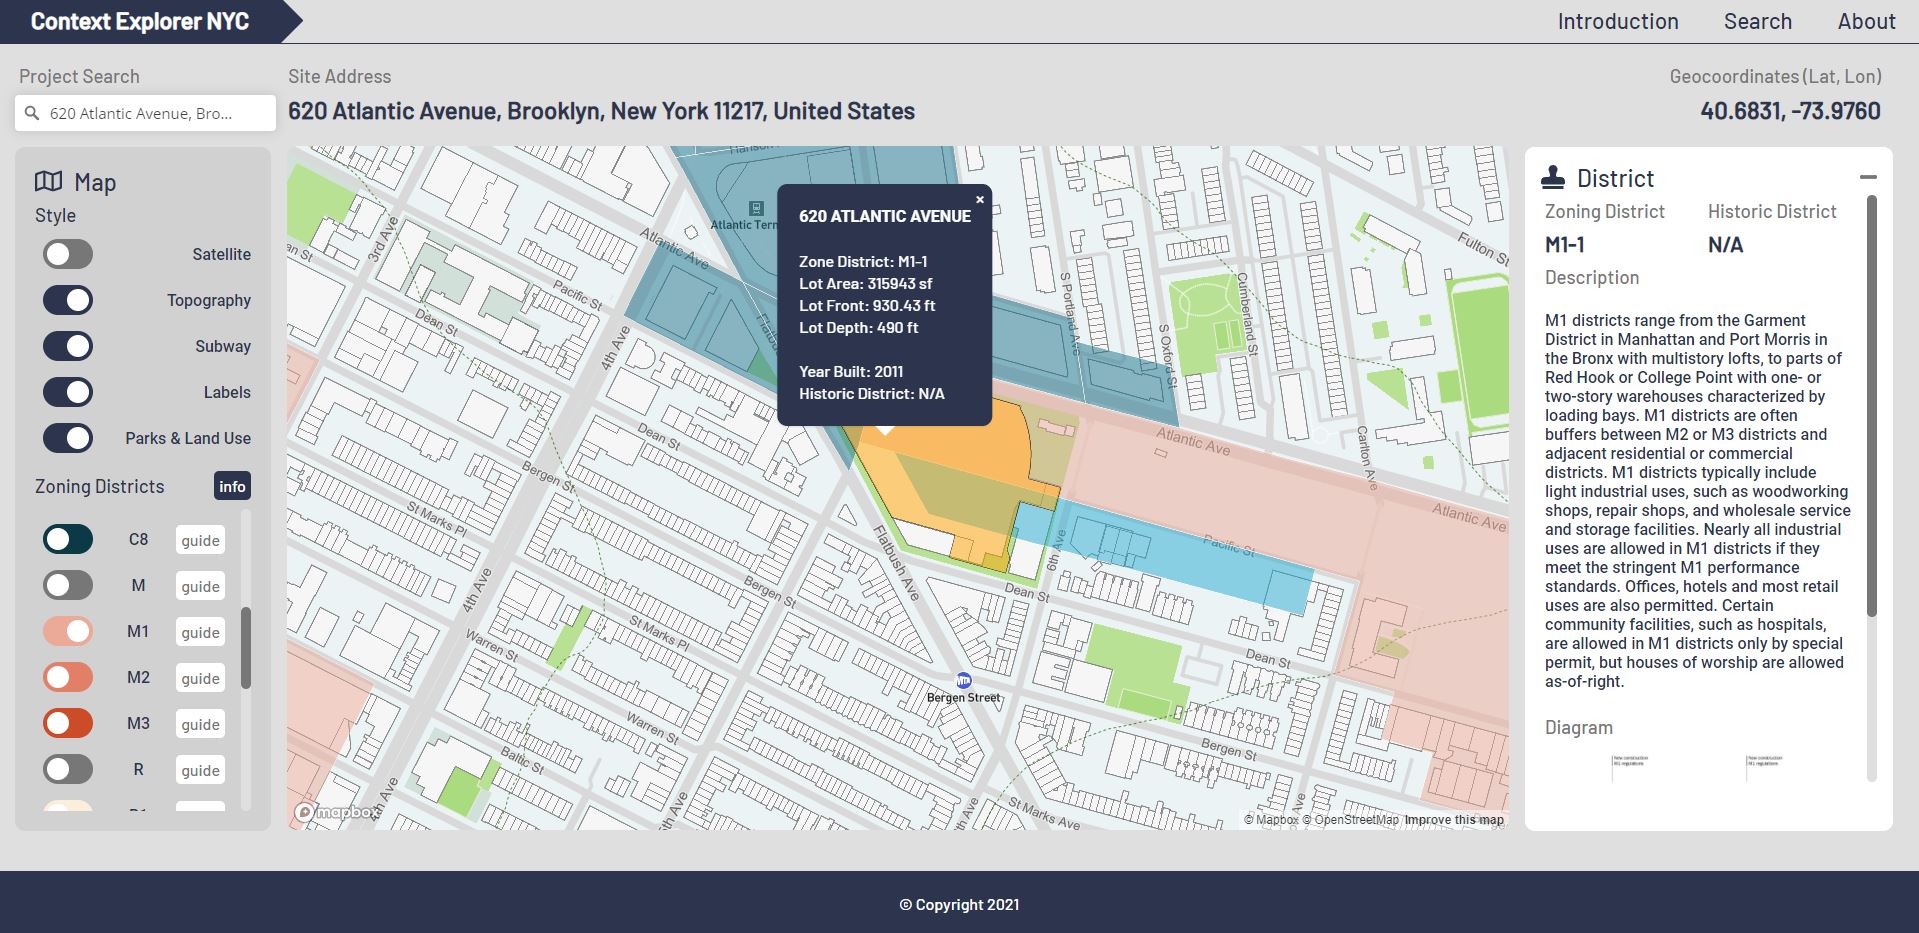
This project allows users to visualize building lot and zoning data in order to facilitate architecture and real estate development. Users can review city-wide zoning data, then zoom into addresses to query neighborhood, district, lot, and building information.
How I Started
Context Explorer NYC helps designers, architects, and citizens become more acquainted with urban and building data. This app aims to visualize zoning and site research needed to jump-start preliminary design projects.
Used Data
How I Built This
We both come from an architecture and real estate background, and we see a demand for more user-friendly visualization tools for urban information. We looked at New York City, where we have both lived and worked. Starting with the Zoning Tax Lot database, we were able to collect lot and building information. The data was then cleaned and reformatted into JSON files using python. Additional zoning and neighborhood information comes from MapPLUTO and other public APIs. The map viewer uses Mapbox, and the web architecture is created with React, with Figma for UI prototyping.


