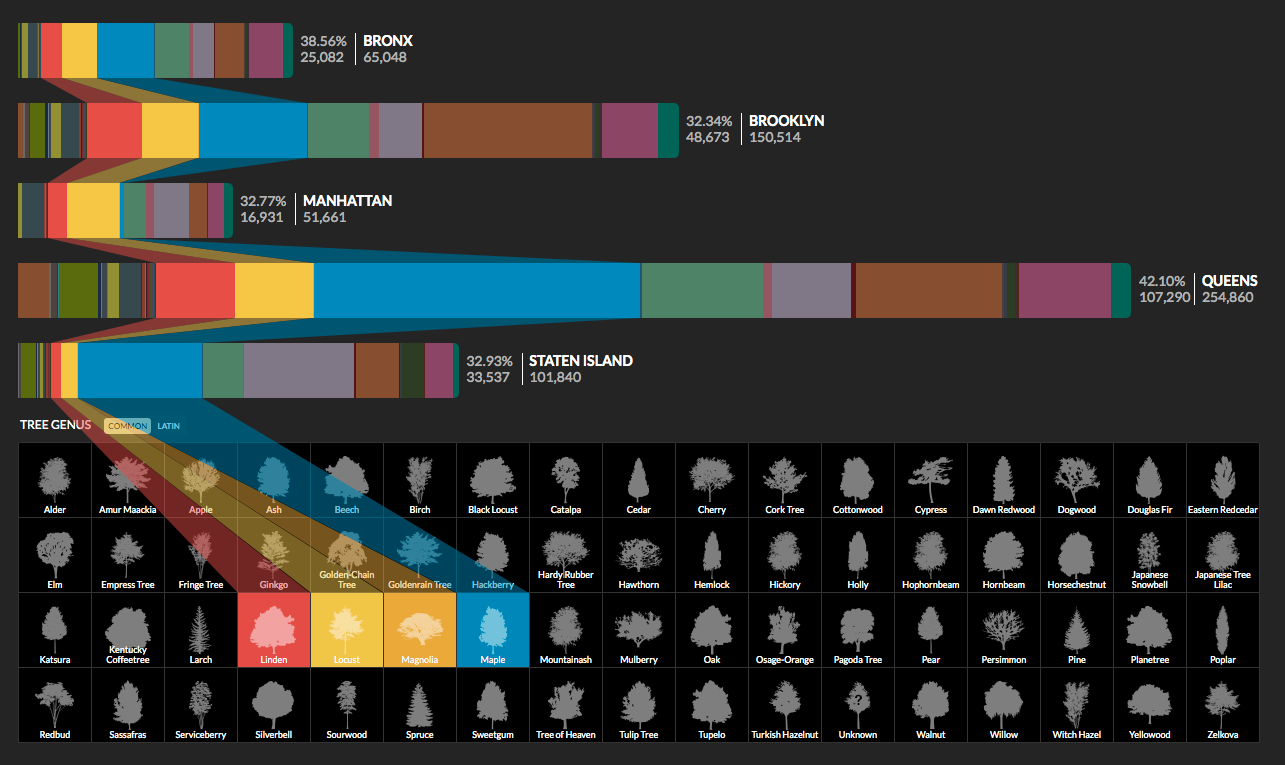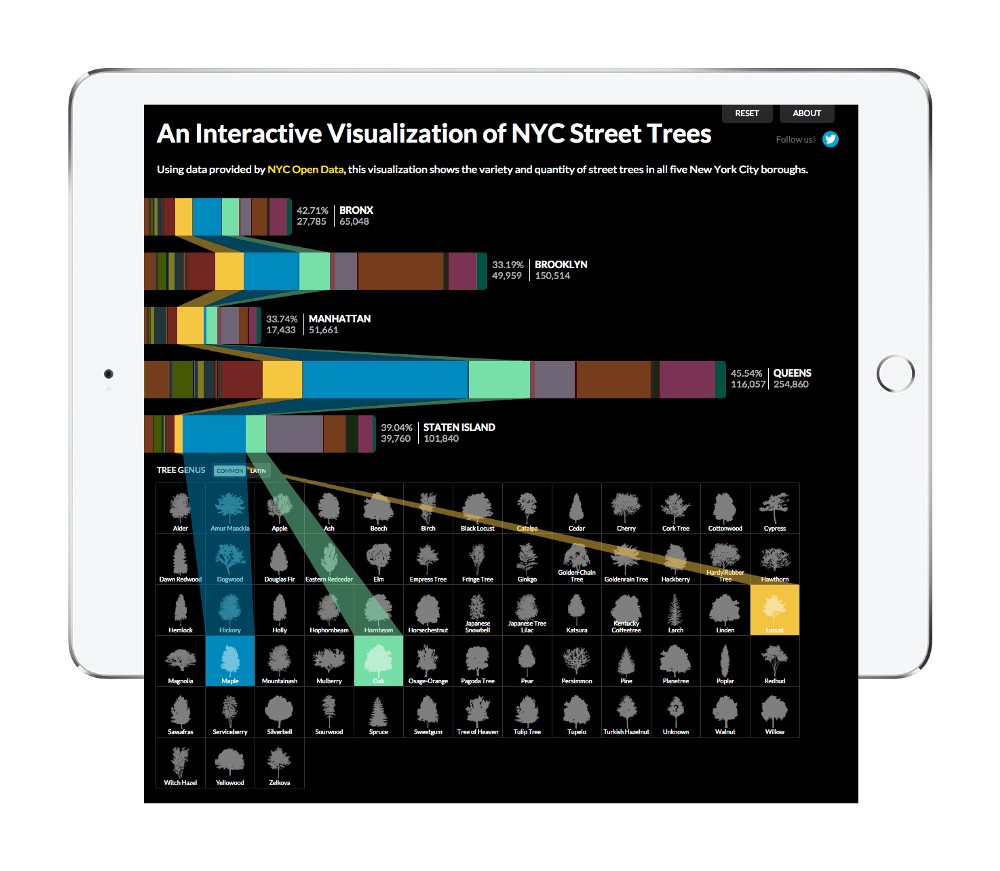
We were curious to see what were some of the common and not so common trees planted in the five boroughs of New York City. While this visualizes trees which we personally love as an essential element of any urban city, we see this as an experiment or model to visualize other datasets in an additive/subtractive format.
How I Started
Using data provided by NYC Open Data, this visualization shows the variety and quantity of street trees in all five New York City boroughs.
Used Data
How I Built This
Allen Yee, Partner, wrote a medium post about the project:


