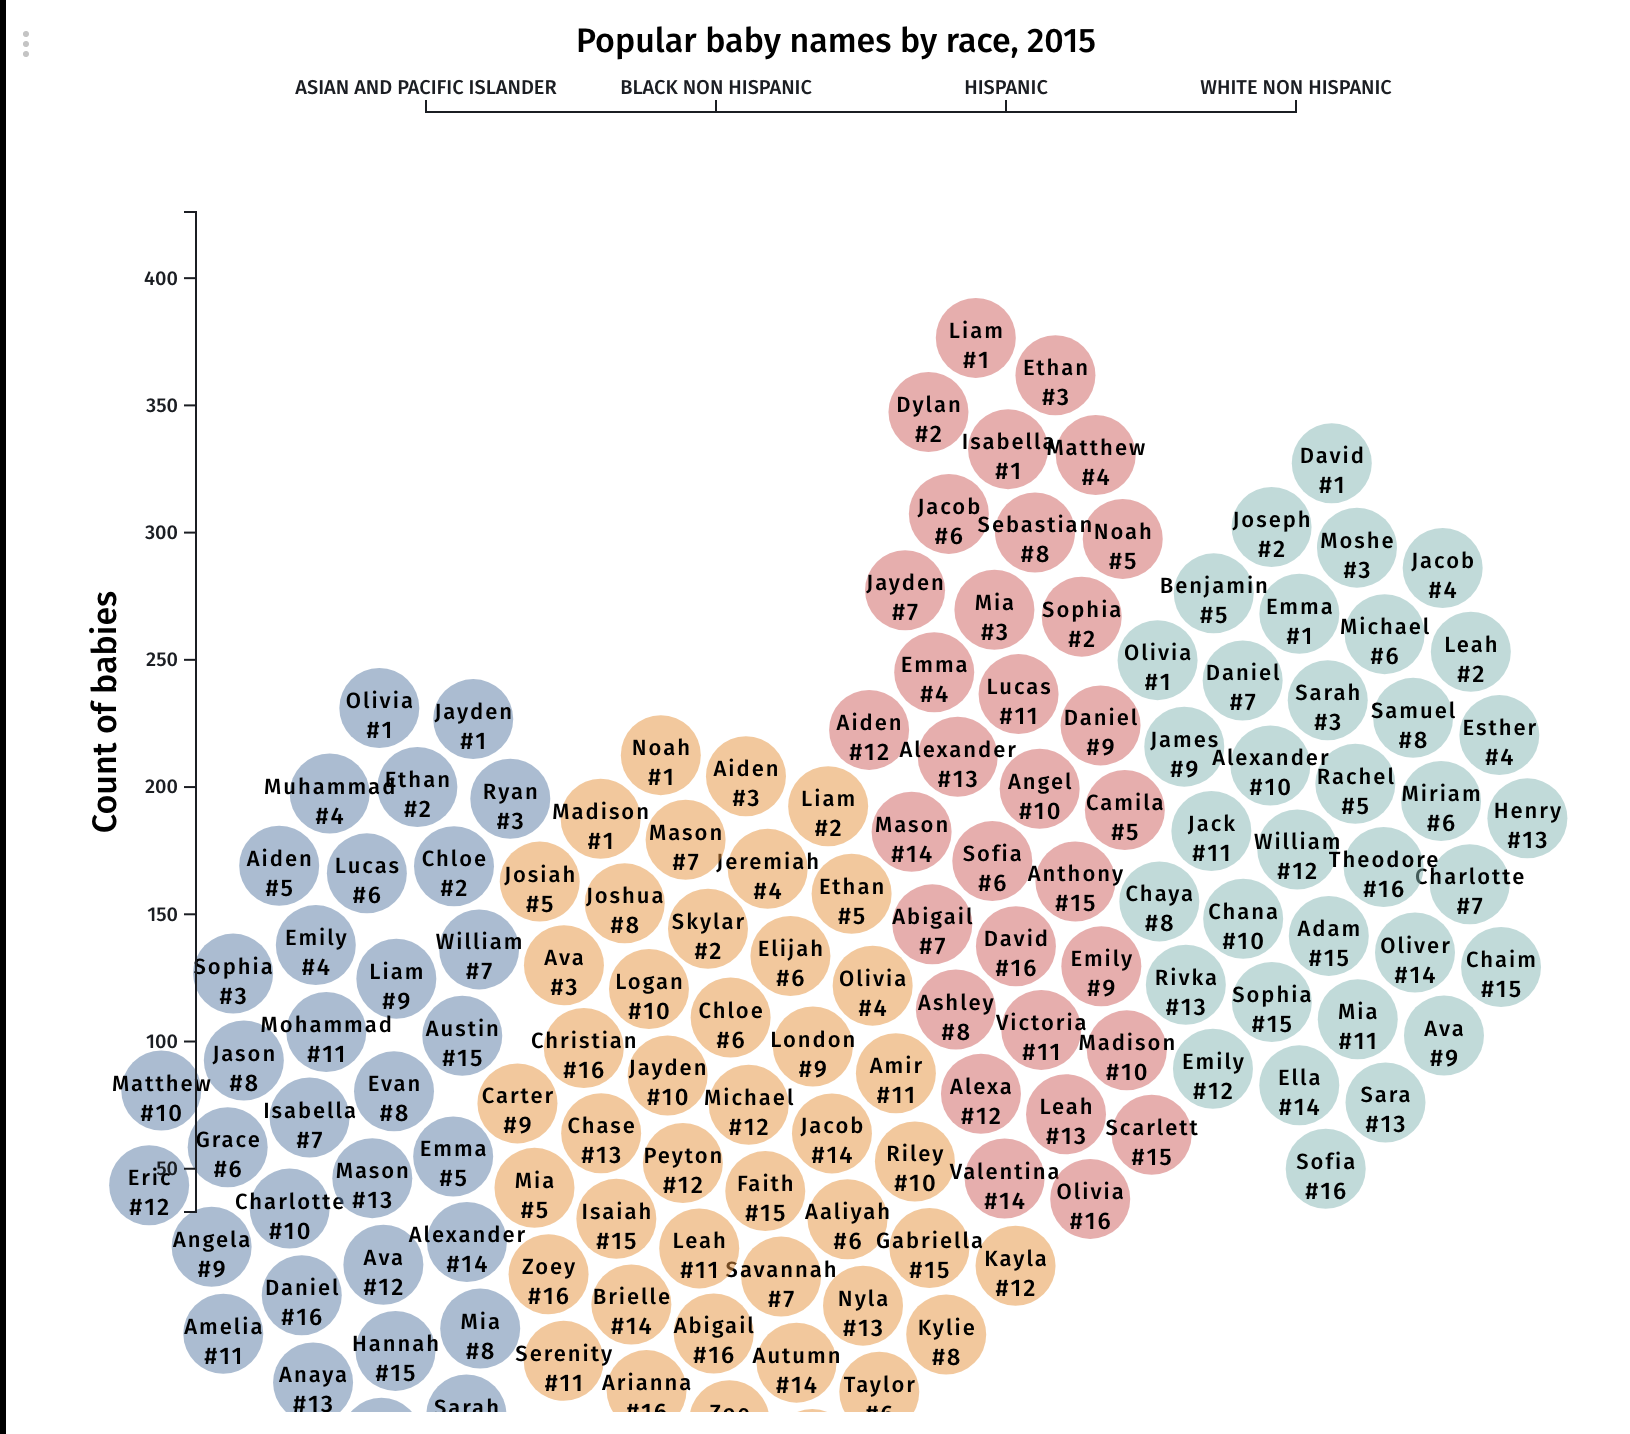
This project allows users to visualize trends in names across time and among racial groups, and explore novel techniques in data visualization using multiple sensory outputs.
How I Started
This animated visualization shows popular baby names by race in New York City, and functions as an abstract musical data-instrument.
How I Built This
Javascript, Socrata API, D3.js, Tone.js, and Tonal on the Observable platform were used to create this visualization.


