
The goal of this project is to show people who may not be very familiar with stop, question, and frisk the incredibly high rates of these actions as well as the significant racial disparities in enforcement. It is also intended to give people who may have not felt the full force of Stop, Question, and Frisk some idea into how prevalent it was in select neighborhoods.
How I Started
This project allows people to look at the rates of stop, question, and frisk actions in NYC by race/ethnicity, as well as see the exact location of each stop over the course of 2003 to 2016 in an interactive visualization.
Used Data
How I Built This
For this project I used R to clean and structure the data and then employed D3.js to visualize the data. There are four different types of data files I created in order to create this visualization:
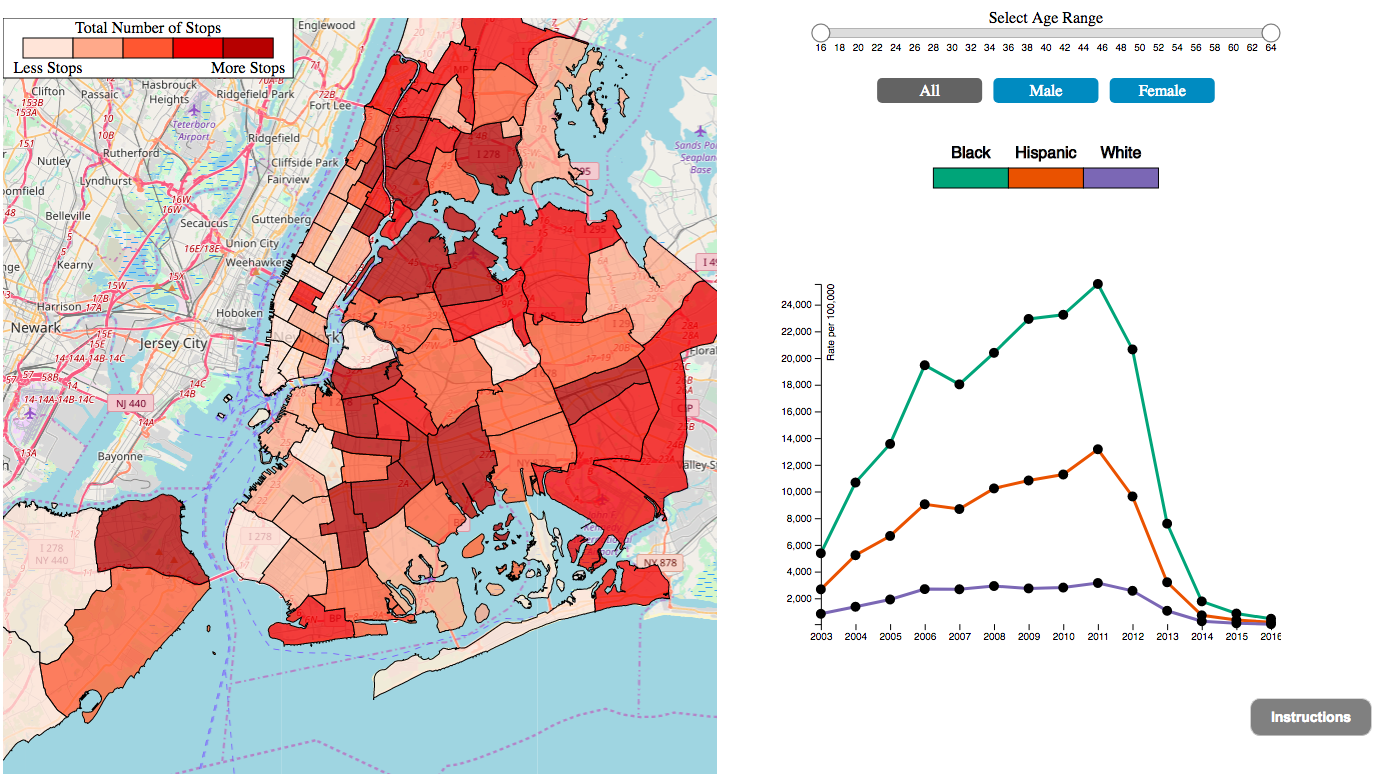
- A GeoJSON file with all the precincts and the total number of stops that occurred in that precinct. These numbers were then converted to colors based on the quintile they fell into.
- Three CSV files for Blacks, Hispanics, and Whites with the total number of stops by sex, age, and year. These files were combined with population files from the census to create rates.
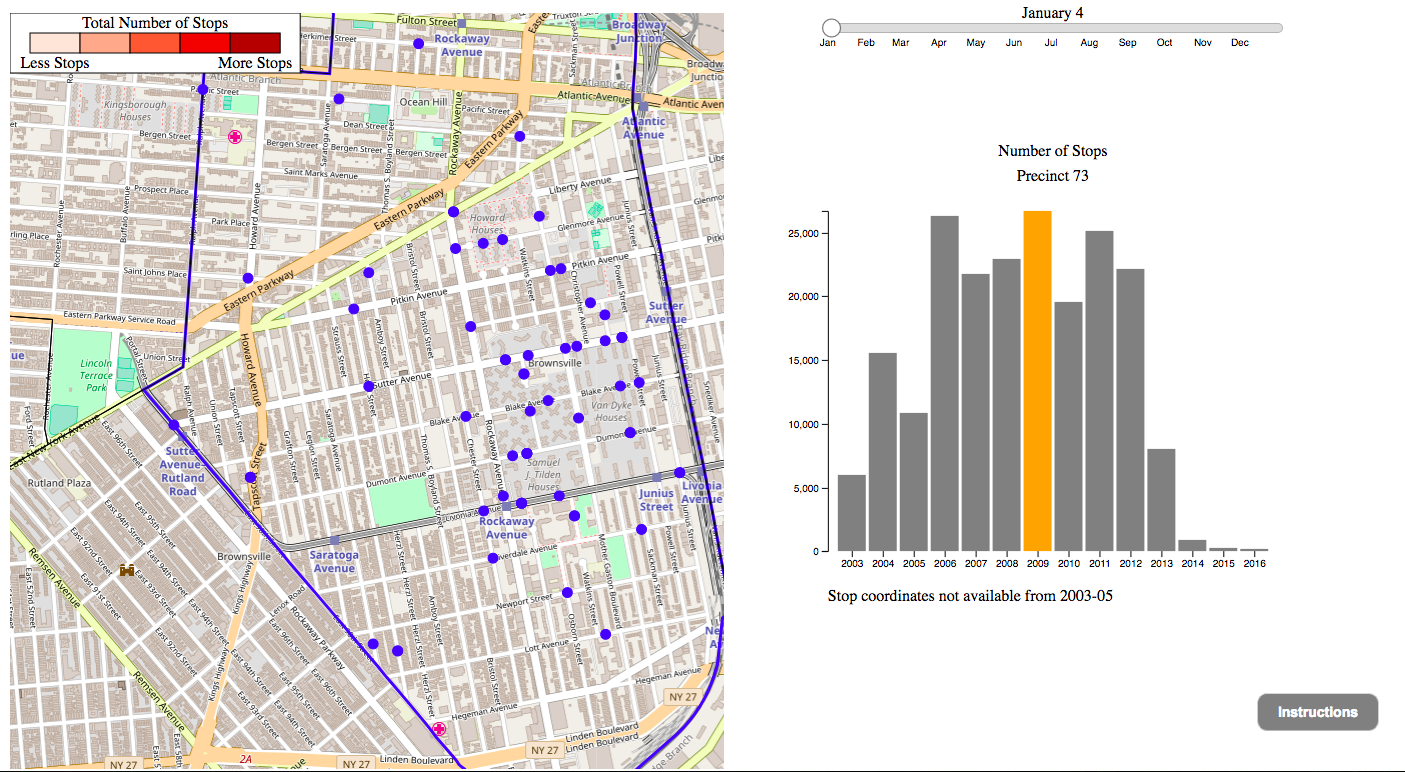
- A CSV file for each precinct with the total number of stops for that precinct by year.
- A GeoJSON file for each combination of precinct and year with the exact latitude and longitude of each stop and the date that the stop occurred.
After all of the data cleaning and re-structuring was completed, I used D3.js to create the interactive visualization that you see.I first started building this project in December 2017, took a break for a while, and recently completed it. I wanted a project I could use to learn D3.js, and this proved to be the perfect project.I would like to thank Evan Misshula for compiling the census data needed for me to calculate rates by race/ethnicity. I would also like to thank Mike Bostock and https://bl.ocks.org/ for all of the great D3.js examples. Finally, I would like to thank OpenStreetMap (https://www.openstreetmap.org/) for providing the maps.